Please evaluate my WT1 essay(table). Thank you!
Posted: Thu Mar 16, 2017 8:30 am
The table shows the Proportions of Pupils Attending Four Secondary School Types Between Between 2000 and 2009.
Summarize the information by selecting and reporting the main features and make comparisons where relevant.
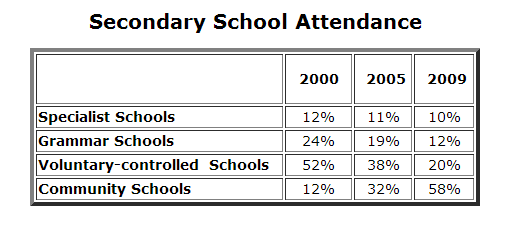
The table illustrates the percentage of attendance in four types of secondary schools across three years, 2000, 2005 and 2009. Overall, a negative trend is seen in Specialist, Grammar and Voluntary-controlled schools while Community schools recorded a positive trend.
Firstly, the percentage of students who attended Specialist schools didn't vary much during the course of 2000 to 2009. From 12% in 2000, it fell modestly to 11% in 2005, and, in 2009, 10% of the pupils appear to have attended them. Similar was the case with Grammar and Voluntary-controlled schools, with both seeing a fall in percentage of students studying in them. Grammar schools saw a decrease from 24% to 12%, while Voluntary-controlled schools saw a steep fall from 52% to 20% during the decade.
However, the proportion of students who attended Community schools witnessed a staggering increase during the 10 year period. The percentage of students grew from a mere 12% in 2000 to 32% in 2005, after which it saw another rise with the students’ attendance going up to 58% in 2009.
Summarize the information by selecting and reporting the main features and make comparisons where relevant.
The table illustrates the percentage of attendance in four types of secondary schools across three years, 2000, 2005 and 2009. Overall, a negative trend is seen in Specialist, Grammar and Voluntary-controlled schools while Community schools recorded a positive trend.
Firstly, the percentage of students who attended Specialist schools didn't vary much during the course of 2000 to 2009. From 12% in 2000, it fell modestly to 11% in 2005, and, in 2009, 10% of the pupils appear to have attended them. Similar was the case with Grammar and Voluntary-controlled schools, with both seeing a fall in percentage of students studying in them. Grammar schools saw a decrease from 24% to 12%, while Voluntary-controlled schools saw a steep fall from 52% to 20% during the decade.
However, the proportion of students who attended Community schools witnessed a staggering increase during the 10 year period. The percentage of students grew from a mere 12% in 2000 to 32% in 2005, after which it saw another rise with the students’ attendance going up to 58% in 2009.